Last Week I participated in one of the hackathons organized by Analytics Vidhya “AmExpert 2019”.
The problem statement involved predicting coupon redemption by customers. Below is the complete problem statement.
Problem Statement
XYZ Credit Card company regularly helps it’s merchants understand their data better and take key business decisions accurately by providing machine learning and analytics consulting. ABC is an established Brick & Mortar retailer that frequently conducts marketing campaigns for its diverse product range. As a merchant of XYZ, they have sought XYZ to assist them in their discount marketing process using the power of machine learning. Can you wear the AmExpert hat and help out ABC?
Discount marketing and coupon usage are very widely used promotional techniques to attract new customers and to retain & reinforce loyalty of existing customers. The measurement of a consumer’s propensity towards coupon usage and the prediction of the redemption behaviour are crucial parameters in assessing the effectiveness of a marketing campaign.
ABC’s promotions are shared across various channels including email, notifications, etc. A number of these campaigns include coupon discounts that are offered for a specific product/range of products. The retailer would like the ability to predict whether customers redeem the coupons received across channels, which will enable the retailer’s marketing team to accurately design coupon construct, and develop more precise and targeted marketing strategies.
The data available in this problem contains the following information, including the details of a sample of campaigns and coupons used in previous campaigns -
- User Demographic Details
- Campaign and coupon Details
- Product details
- Previous transactions
Based on previous transaction & performance data from the last 18 campaigns, predict the probability for the next 10 campaigns in the test set for each coupon and customer combination, whether the customer will redeem the coupon or not?
Submissions were evaluated on area under the ROC curve between the predicted probability and the observed target
The datasets and the submission code can be found here.
I used R programming for this hackathon.
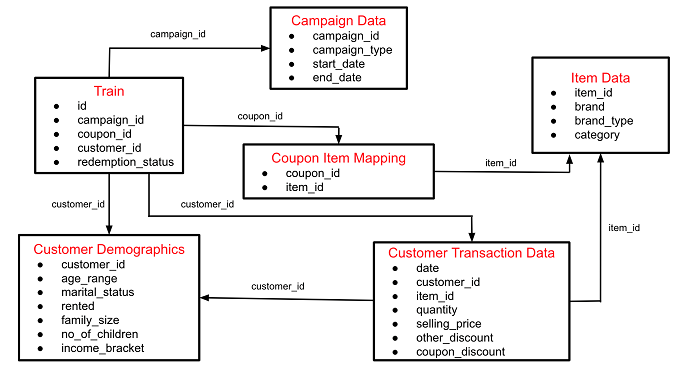
Data Schema
Data Exploration
The code used for this entire process is present here.
As part of data exploration and feature engineering, following steps were taken -
Exploration of train data -
- Highly skewed data (99.07%:0.93%) i.e only 0.93% of the coupons are redeemed.
- id is the identifier and cannot be used for model building.
- Other 3 variables are also idenitifiers for customers, campaigns and coupons and should not be used directly unless necessary.
Exploration of campaign data -
- campaign_type - there are 2 types of campaign (masked) with 6 campaigns being of one type and 22 of the other.
- campaign_duration - this variable was created from the start date and end date provided.
Exploration of coupon item mapping -
- This data had only 2 variables. One coupon id was valid for multiple items and multiple coupons could be used to purchase a particular item.
- no_items_on_discount - This variable tells us no. of items valid on each coupon id.
This data was joined with item data to get more information. Exploartion alongwith item data -
- no_brands_on_discount - This tells us no. of brands redeemable by each coupon.
- no_brands_type_on_discount - This tells us no. of brand types redeemable by each coupon(although we have only 2, and from exploratory it seemed very important).
- no_categories_on_discount - This tells us no. of categories redeemable by each coupon.
Exploration of Customer Demographics -
- Demographic data is available only for 760 customers while we have a lot more customer id’s in train data. Expect Null values generated when joined.
- There were some missing values in couple of variables here which were treated with appropriate logics for some cases and replaced with mode for remaining cases.
Exploration of Customer Transaction (Transactions info is not available for test data campaigns. The campaigns in train data are from beginning of 2017 to mid 2018 while the one’s in test data start from mid 2018) -
- Initially, I joined transaction data with items data to get item related info.
- Revenue_from_customer - How much revenue was generated from each customer.
- no_items_purchased - No. of items purchased by the customer.
- no_brands_purchased - No. of brands purchased by the customer.
- no_brand_type_purchased - No. of brand type purchased by the customer.(removed as everyone purchased 2)
- no_category_type_purchased - No. of category purchased by the customer.
- no_items_purchased_cd - No. of items purchased by the customer by redeeming coupon.
- no_brands_purchased_cd - No. of brands purchased by the customer by redeeming coupon.
- no_brand_type_purchased_cd - No. of brand type purchased by the customer by redeeming coupon.
- no_category_purchased_cd - No. of category purchased by the customer by redeeming coupon.
- max_sp_coupon - maximum selling price per unit of item that can be bought using a coupon.
- min_sp_coupon - minimum selling price per unit of item that can be bought using a coupon.
- mean_sp_coupon - mean selling price per unit of item that can be bought using a coupon.
- max_sp_customer - maximum selling price per unit of item that has been bought by the customer.
- min_sp_customer - minimum selling price per unit of item that has been bought by the customer.
- mean_sp_customer - mean selling price per unit of item that has been bought by the customer.
- diff_max_sp - difference between max selling price per unit a coupon offers and a customer has purchased.
- diff_min_sp - difference between min selling price per unit a coupon offers and a customer has purchased.
- diff_mean_sp - difference between mean selling price per unit a coupon offers and a customer has purchased.
Additional Variables (and most importatnt ones!)
- redemption_chance - A new flag variable that provides info regarding an item that was purchased by a customer and can be redeemed by a given coupon. (The thought behind this being, if a coupon is given to a customer for items he doesn’t purchase, he will probably not redeem it). This turned out to be the single most important variable. I tried a couple of variations of this but obtained best results with just this one.
- avg_cust_coupon_disc_perc - Average coupon percentage discount which a customer received.
- avg_coupon_disc_perc - Average discount percentage that could be offered by a coupon.
After joining all the datatsets together, another round of EDA was done and a lot of categorical variables were clubbed together to reduce the no. of categories. Also, the missing values generated from customer demographics were treated as a separate category ‘Unknown’.
Model Building and Selection -
- Algorithms tried were Logistic regression, Random Forest and xgboost but from initial results, it seemed xgboost is giving better results.
- 5 fold cv was done on xgboost and the propensity obtained was averaged across the 5 models.
- Although the train and validation auc was coming out to be around 0.92 the test results uploaded gave a score of 0.85.
- Once, variable redemption_chance was discovered, the train results improved to 0.98 and test to 0.91.
- I also tried sampling techniques (SMOTE and undersampling) as data was imbalanced but resuts did not improve.
- The customer and coupon id variables improved the score to 0.925.
- Post this, I tried standardizing the continous variables before running the model which further improved the result to 0.93.
- I also tried ensembling couple of submission results but could not improve the score further.
- Final Selected Submission had test auc of 0.9305 and private result for this turned out to be 0.915 although my personal best private score was 0.92 from one of the ensemble models.
Learning -
After looking at approaches from folks who acheived top ranks, one very important concept I missed was data leakage. Since, we had dates of transactions and campaigns available, the variables calculated should have considered info only before a pariticular campaign was launched. Also, the model validation startegy should have been to split the data on campaign as campaigns were from diff time periods.
Final Public LeaderBoard Rank achieved was 35 out of 1000+ participants. Private LeaderBoard rank achieved is 41.