Most of the Classification Algorithms gives out probability corresponding to each observation as their output. Now, we have to use these probabilities to evaluate how good or bad our model is. There are several metrics available that can be used for this purpose but broadly there can be two approaches, using a threshold on probability and evaluation directly through probabilities.
Setting a Threshold
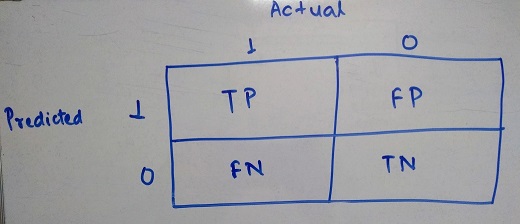
In this approach we decide on a probability threshold. Based on this, all observations with probability greater than the threshold will be considered as 1 and rest as 0. This brings our output in the form of actual outcome as binary variable. So, a confusion matrix can be drawn like below.

Some points to be noted about the Confusion Matrix
- The TP block represents count of True Positive observations (Actual value was True and Predicted value is also True)
- The TN block represents count of True Negative observations (Actual value was False and Predicted value is aslo False)
- The FP block represents count of False Positive observations (Falsely Predicted to be Positive - Actual was False but Prediction was True)
- The FN block represents count of False Negative observations (Falsely Predicted to be Negative - Actual was True but Prediction was False)
The simplest metric that can be calculated is Mis-Classification Error, MCE = (FN+TN) ⁄ (TP+FP+TN+FN)
But this metric has a lot of demerits as it will not give you complete picture of the situation. Let’s say, there are total 10000 observations and the distribution of binary outcome variable is 98:2 i.e 9800 observations have outcome as 1 and only 200 observations have outcome as 0. In this scenario, if my model just classifies every observation to be 1, I still get a misclassification error of just 2%. Looking at this, it would seem like we have a pretty solid model at hand unkown to the tricks it has played.
That’s why we need better metrics that would inform us about both True and False cases - in comes precision and recall.
Precision = TP ⁄ (TP+FP) ⇒ out of all the True Predicted cases, how many were actually True.
Recall = TP ⁄ (TP+FN) ⇒ out of all the actual True cases, how many were correctly predicted to be True.
These can be calculated for negative cases as well. For the above example, if we calculated these metrics corresponding to False cases, one would notice that Precision and Recall both turn out to be 0 which will indicate there is something wrong with the model.
Now, while building the model through various iterations, one might be thinking which metric should be considered for final model selection. This depends on the problem statement one is solving and is a case of Type I error vs Type II error.
Precision focuses on situation where we want to be sure that the True predictions are actually True. It will not take into account if Actual True cases were predcited to be False. So, it will be ideal for Spam detection like problems. Here, we want to be sure that if an email is tagged to be spam, it was actually a spam but it would be okay to let some spam emails be passed into the inbox. On the other hand it might be problematic if an important email was tagged as spam.
Recall focuses on situation where we want to identify all the True cases correctly. It will care less if Actually False cases were predicted to be True also. An example would be Cancer Detection where it is very important that a person suffering from cancer gets the treatment.
There is a trade off between Precision and Recall as when one increases, another decreases and it would be good for us if both of them had high values.
To solve this issue, there is another metric commonly used i.e. F1-Score = 2 * Precision * Recall ⁄ (Precision+Recall).
Again, the higher the F1-Score is, the better our model is.
Note: The Threshold of probability can be decided based on a grid search where we vary the probability from 0 and 1 and look for best value of evaluation metric being used.
I will be talking about dealing with Probabilites without using Threshold in the next post.